

Matplotlib
keyboard_arrow_down 83 guides
chevron_leftAxes Cookbook
check_circle
Mark as learned thumb_up
0
thumb_down
0
chat_bubble_outline
0
Comment auto_stories Bi-column layout
settings
Setting y-axis limit in Matplotlib
schedule Aug 11, 2023
Last updated local_offer
Tags Python●Matplotlib
tocTable of Contents
expand_more Master the mathematics behind data science with 100+ top-tier guides
Start your free 7-days trial now!
Start your free 7-days trial now!
To set a limit on the y-axis (i.e. the range), use the y-lim(~) method:
plt.plot([1,2,3])plt.ylim(0,4)plt.show()
The output is as follows:
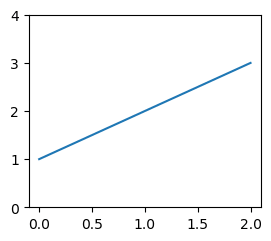
Notice how the y-axis goes from 0 to 4, as specified.
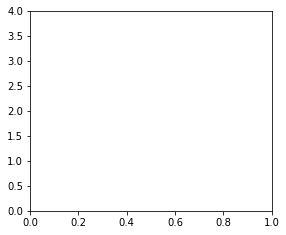
Alternatively you can use the set_ylim(~) method:
fig, ax = plt.subplots()ax.set_ylim(0,4)
Which produces the output:
Published by Isshin Inada
Edited by 0 others
Did you find this page useful?
thumb_up
thumb_down
Comment
Citation
Ask a question or leave a feedback...
thumb_up
0
thumb_down
0
chat_bubble_outline
0
settings
Enjoy our search
Hit / to insta-search docs and recipes!