

Matplotlib
keyboard_arrow_down 83 guides
chevron_leftAxes Cookbook
check_circle
Mark as learned thumb_up
2
thumb_down
1
chat_bubble_outline
0
Comment auto_stories Bi-column layout
settings
Drawing the axis line in Matplotlib
schedule Aug 12, 2023
Last updated local_offer
Tags Python●Matplotlib
tocTable of Contents
expand_more Master the mathematics behind data science with 100+ top-tier guides
Start your free 7-days trial now!
Start your free 7-days trial now!
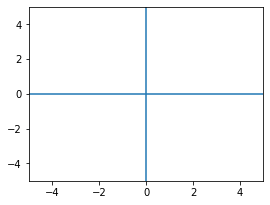
To draw the axis line in Matplotlib, use the axhline(~) and axvline(~) methods:
plt.axhline(0) #x-axis lineplt.axvline(0) #y-axis lineplt.xlim(-5,5)plt.ylim(-5,5)plt.show()
The output is as follows:
Changing transparency
Usually, you want the axis lines to be slightly transparent, so here's some code for that:
plt.axhline(0, color="blue", alpha=0.3)plt.axvline(0, color="blue", alpha=0.3)plt.xlim(-5,5)plt.ylim(-5,5)plt.show()
The output is as follows:
Published by Isshin Inada
Edited by 0 others
Did you find this page useful?
thumb_up
thumb_down
Comment
Citation
Ask a question or leave a feedback...
thumb_up
2
thumb_down
1
chat_bubble_outline
0
settings
Enjoy our search
Hit / to insta-search docs and recipes!