

Matplotlib
keyboard_arrow_down 83 guides
chevron_leftAxes Cookbook
check_circle
Mark as learned thumb_up
0
thumb_down
0
chat_bubble_outline
0
Comment auto_stories Bi-column layout
settings
Removing axis in Matplotlib
schedule Aug 12, 2023
Last updated local_offer
Tags Python●Matplotlib
tocTable of Contents
expand_more Master the mathematics behind data science with 100+ top-tier guides
Start your free 7-days trial now!
Start your free 7-days trial now!
To completely remove an axis in Matplotlib, set plt.axis("off") like so:
plt.figure(figsize=(3,2.5))plt.plot([1,2,3])plt.axis("off")plt.show()
This gives the following:
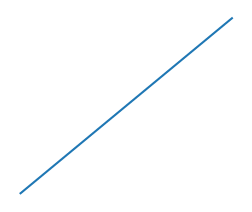
Notice how all the axis labels are removed as well, leaving just the curve.
Published by Isshin Inada
Edited by 0 others
Did you find this page useful?
thumb_up
thumb_down
Comment
Citation
Ask a question or leave a feedback...
thumb_up
0
thumb_down
0
chat_bubble_outline
0
settings
Enjoy our search
Hit / to insta-search docs and recipes!