

Matplotlib
keyboard_arrow_down 83 guides
chevron_leftAxes Cookbook
check_circle
Mark as learned thumb_up
1
thumb_down
0
chat_bubble_outline
0
Comment auto_stories Bi-column layout
settings
Setting only the lower or upper limit in Matplotlib
schedule Aug 12, 2023
Last updated local_offer
Tags Python●Matplotlib
tocTable of Contents
expand_more Master the mathematics behind data science with 100+ top-tier guides
Start your free 7-days trial now!
Start your free 7-days trial now!
To set only the lower or upper limit for plt.xlim(~), set either the left or right parameter:
plt.xlim(left=-2)plt.xlim(right=2)
For plt.ylim(~), set either the bottom or top parameter:
plt.ylim(bottom=-2)plt.ylim(top=2)
WARNING
For the effect to apply, you must call xlim(~) or ylim(~) after plotting the curve (e.g. after plt.plot(~)).
Example
Suppose we have the following parabola:
x = np.linspace(-3, 3, 1000)plt.plot(x, x**2)
The default output is as follows:
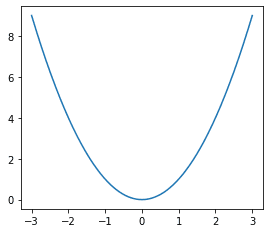
Our goal is to set the lower y-limit of graph to 0, and leave the upper y-limit intact. We can use the following snippet:
x = np.linspace(-3, 3, 1000)plt.plot(x, x**2)plt.ylim(bottom=0) # Make sure you call this after the plot(~) method
This gives us the following:

We see that our curve starts from y=0 now.
Published by Isshin Inada
Edited by 0 others
Did you find this page useful?
thumb_up
thumb_down
Comment
Citation
Ask a question or leave a feedback...
thumb_up
1
thumb_down
0
chat_bubble_outline
0
settings
Enjoy our search
Hit / to insta-search docs and recipes!