

Getting Started with Dagster
Start your free 7-days trial now!
What is Dagster?
Dagster is an open-source data orchestrator tool that helps you build, test, and deploy data pipelines. With Dagster, you can define your pipelines using Python, and it provides a visual interface to monitor the pipeline's execution. Here's a sneak peek:
Such a graph is useful because:
we can see how data flows and changes through the pipeline.
instead of executing the pipeline from the very beginning every time, we can cache our results at each stage and execute the pipeline at any intermediate step.
Getting started with Dagster
Setting up our environment
Start by creating a virtual environment and activating it:
python -m venv .venv.venv\Scripts\activate # For Windowssource .venv/bin/activate # For Linux and MacOS
We then install the dependencies of our project:
pip install dagsterpip install dagster-webserverpip install pandas
Note the following:
dagsteris the main package that contains all the Dagster's core logic.dagster-webserveris for the Dagster UI dashboard.pandasis for doing some simple data processing.
Next, create a folder called my_dagster_code_location and within it, create two empty Python files:
.venvmy_dagster_code_location├── __init__.py└── my_assets.py
We will cover the concept of code location in a separate guide - don't worry about it for now!
Defining our assets
In the my_assets.py, copy and paste the following code:
Here, note the following:
we added Dagster's
@assetdecorator to indicate that the function should be treated as a Dagster asset, which is essentially a piece of data that flows through a pipeline. In this case, theget_iris_datareturns an asset (in the form of a Pandas DataFrame), which we nameiris_data.we also defined another asset called
setosa, which takes in as input theiris_dataasset.
Creating an initialization script
Next, in the __init__.py, copy and paste the following content:
                    from dagster import Definitions, load_assets_from_modulesfrom . import my_assets
all_assets = load_assets_from_modules([my_assets])defs = Definitions(assets=all_assets)
Note the following:
we import our
my_assetsmodule and use Dagster'sload_assets_from_modules(-)method to get a reference to all the assets we've defined in the module.we then instantiate a
Definitionsobject that contains all the entities such as assets, jobs, resources and schedules used for our Dagster project. Since we only make use of assets for now, we will simply pass in our assets and nothing else.
Don't worry about the other types of entities for now - we will go over them in detail in the latter guides 🙂.
Launching the Dagster UI
To launch the Dagster UI (or dagster-webserver), type the following in the terminal:
                    dagster-webserver -m my_dagster_code_location


            ...2023-07-25 22:50:55 +0800 - dagster-webserver - INFO - Serving dagster-webserver on http://127.0.0.1:3000 in process 35413
Here, the -m flag is to specify the location of the directory that contains the __init__.py file.
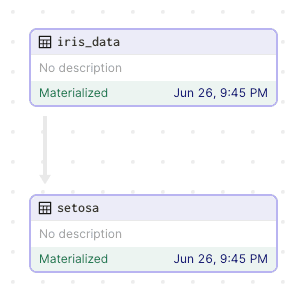
We now have a local Dagster server hosted at localhost:3000. We should see the following data pipeline:
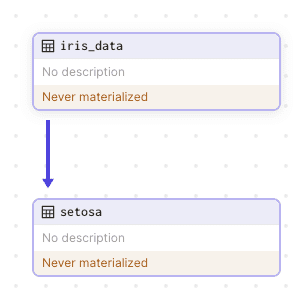
We can see the assets (iris_data and setosa) that we've defined in our code earlier! There is also an arrow pointing from iris_data to setosa, which means that setosa is dependent on iris_data - exactly like how we defined it in our code!
However, Dagster is telling us that the assets have never been materialized. In Dagster, to materialize means to create or update an asset. Even though we have defined an asset, we have never actually created it - this is what Dagster is telling us.
Materializing our assets
To materialize our asset, click on the black Materialize button at the top-right corner:
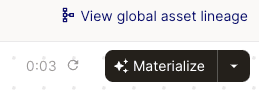
We see that our asset has been materialized:
Note that since our setosa asset depends on iris_data, we say that:
setosais a downstream asset.iris_datais an upstream asset.
Checking meta-information about our assets
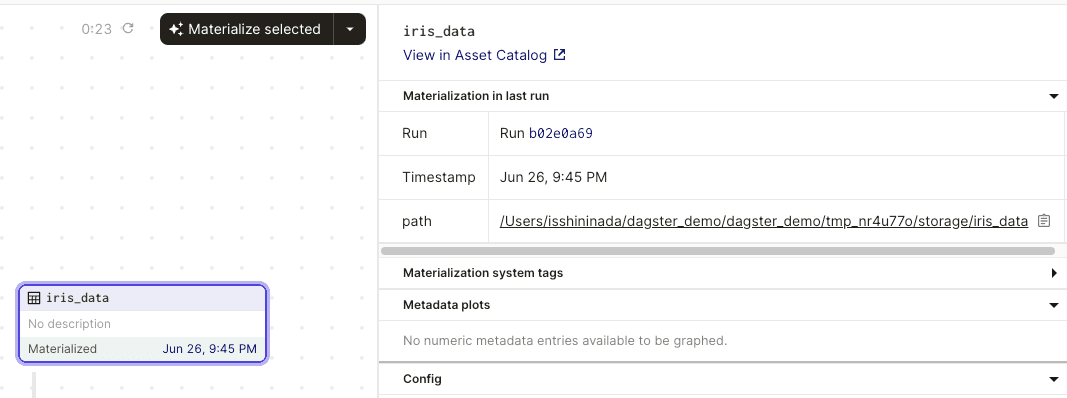
Clicking on our iris_data asset will open up the following panel:
Note the following:
whenever we materialize an asset, we create what's called a run. We can think of a run as a particular execution of our data pipeline. We see that the ID of our run is
b02e0a69.we also see the path of the asset (
../tmp_nr4u770/storage/iris_data). By default, Dagster will create a temporary folder in our local repository and store the asset in there. This is only a temporary folder because it is deleted once we stop our Dagster server. This means that if we restart our Dagster server, we will see the label "Never Materialized" for all of our assets. We will later explore how to persistently store our materialized assets.
By default, the materialized assets are stored in pickle format. We can modify the file format (e.g. csv) by using IO managers.
Exploring the run tab
Click on the Runs tab in the header:
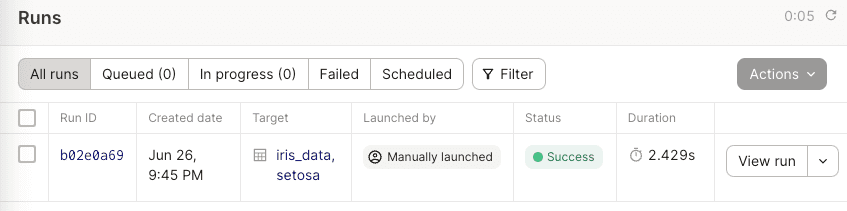
Note the following:
we can see meta information such as Run ID, created date, run duration and so on.
the assets that we've materialized are shown under Target.
Visualizing the run timeline
Now, click on the View run button on the right. This will open up a timeline of the events that happen in the run:
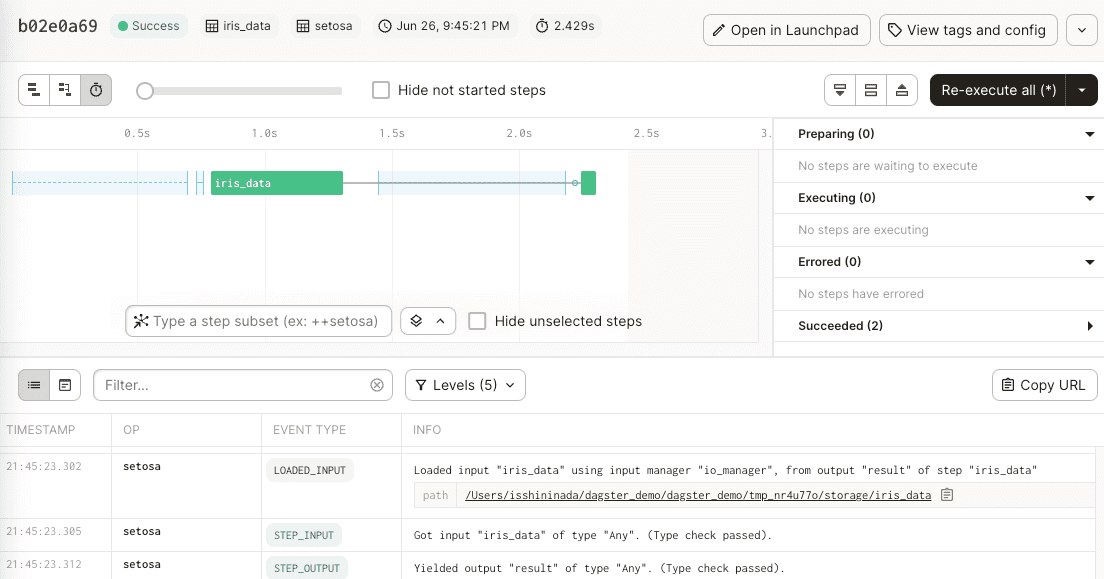
Note the following:
we see that creating the
iris_dataasset takes much longer compared to creating thesetosaasset.this timeline updates in real-time as our run progresses. Since our run completes almost immediately, the timeline that we see is already complete and thus no live updates are going on.
we will be able to see live logs at the bottom! Later, we will go into more detail on how we can log information at different levels (e.g.
info,error,critical).
As you can imagine, this timeline is extremely useful for profiling - we can identify slow operations in our pipeline and optimize them!