Drawing a histogram in Matplotlib
Start your free 7-days trial now!
We can use the ax.hist(~) method to draw a basic histogram in Matplotlib.
Drawing a basic histogram
Object Oriented Interface
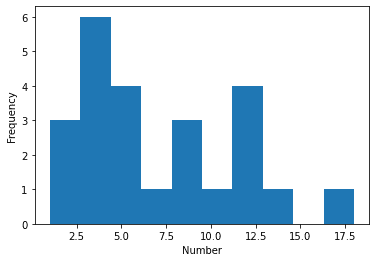
To plot a histogram showing the distribution of some numbers:
nums = [1,1,2,3,3,3,3,3,4,5,6,6,6,7,8,8,9,10,12,12,12,12,14,18]fig,ax = plt.subplots()ax.hist(nums)ax.set_xlabel('Number')ax.set_ylabel('Frequency')plt.show()
This produces the following output:
Pyplot Interface
To plot the same histogram as above, but using Pyplot Interface:
nums = [1,1,2,3,3,3,3,3,4,5,6,6,6,7,8,8,9,10,12,12,12,12,14,18]_ = plt.hist(nums)_ = plt.xlabel('Number')_ = plt.ylabel('Frequency')plt.show()
It is good practice to assign the various plotting statements to a dummy variable _ so that we do not display any unnecessary output.
Setting the number of bins
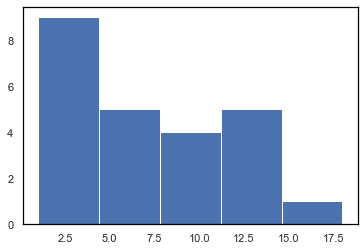
By default the number of bins is 10, however, we can customize this using the bins argument:
nums = [1,1,2,3,3,3,3,3,4,5,6,6,6,7,8,8,9,10,12,12,12,12,14,18]fig,ax = plt.subplots()ax.hist(nums, bins=5)plt.show()
Now the output histogram only has 5 bins:
Multiple variables on the same histogram
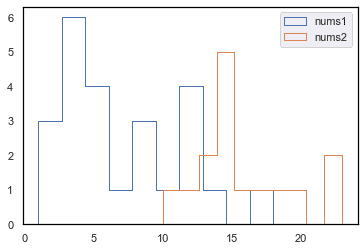
We can plot multiple variables on the same histogram:
nums1 = [1,1,2,3,3,3,3,3,4,5,6,6,6,7,8,8,9,10,12,12,12,12,14,18]nums2= [10,12,13,13,14,14,15,15,15,16,17,18,20,22,23]fig,ax = plt.subplots()ax.hist(nums1, label="nums1", histtype="step")ax.hist(nums2, label="nums2", histtype="step")plt.legend()plt.show()
The histtype="step" means we only see the outlines of each histogram. This enables us to easily see the distribution for each variable when there is overlap between the two.
Visualizing the distribution of random numbers
We want to visualize the distribution of random numbers that we generate.
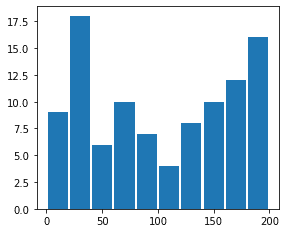
We generate 100 random integers between 0 (inclusive) and 200 (exclusive):
                    x = np.random.randint(low=0, high=200, size=100)x


            array([122,  76, 147, 160, 100, 173,  62,  21,  50, 150,  75,  19,  87,       ...       83,  43, 184, 153, 148, 198,  88,   8, 196])
We then draw a histogram showing the distribution of the data-points:
plt.hist(x, range=(0,200), bins=10, rwidth=0.9)
Here,
rangeis a tuple indicating the lower and upper boundbinsis number of bars you wantrwidthis the width of each bin. If we setrwidth=1, then there will be no gap between the bins.
The output is as follows: