

Matplotlib
keyboard_arrow_down 83 guides
chevron_leftColors Cookbook
Adding multiple plots with different colorsChanging background color of figureChanging color based on valueChanging line color of a plotChanging the background color of a plotChanging the color of axesChanging the color of tick labelsDrawing semi-transparent plotsFilling in the area above a curveFilling in the area underneath a curveGetting specific color value from a color mapInverting color mapsMaking the background figure transparentShading an area
check_circle
Mark as learned thumb_up
0
thumb_down
0
chat_bubble_outline
0
Comment auto_stories Bi-column layout
settings
Shading an area in Matplotlib
schedule Aug 11, 2023
Last updated local_offer
Tags Python●Matplotlib
tocTable of Contents
expand_more Master the mathematics behind data science with 100+ top-tier guides
Start your free 7-days trial now!
Start your free 7-days trial now!
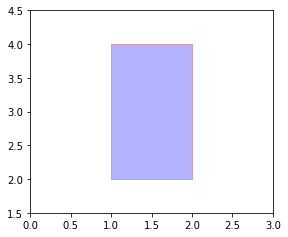
To shade an area in Matplotlib, use the fill(~) method:
plt.xlim(0, 3)plt.ylim(1.5, 4.5)plt.fill([1,2,2,1], [4,4,2,2], "blue", alpha=0.3, edgecolor="red")plt.show()
Here, the first argument is an array of the x coordinates, from top-left clockwise. The second argument is an array of the y-coordinates, again, from top-left clockwise.
The output is as follows:
Published by Isshin Inada
Edited by 0 others
Did you find this page useful?
thumb_up
thumb_down
Comment
Citation
Ask a question or leave a feedback...
thumb_up
0
thumb_down
0
chat_bubble_outline
0
settings
Enjoy our search
Hit / to insta-search docs and recipes!