

Matplotlib
keyboard_arrow_down 83 guides
chevron_leftColors Cookbook
Adding multiple plots with different colorsChanging background color of figureChanging color based on valueChanging line color of a plotChanging the background color of a plotChanging the color of axesChanging the color of tick labelsDrawing semi-transparent plotsFilling in the area above a curveFilling in the area underneath a curveGetting specific color value from a color mapInverting color mapsMaking the background figure transparentShading an area
check_circle
Mark as learned thumb_up
1
thumb_down
0
chat_bubble_outline
0
Comment auto_stories Bi-column layout
settings
Changing the color of axes in Matplotlib
schedule Aug 12, 2023
Last updated local_offer
Tags Python●Matplotlib
tocTable of Contents
expand_more Master the mathematics behind data science with 100+ top-tier guides
Start your free 7-days trial now!
Start your free 7-days trial now!
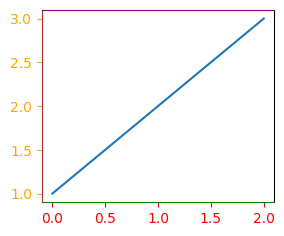
To change the color of axes in Matplotlib:
plt.plot([1,2,3])ax = plt.gca()ax.spines["bottom"].set_color("green") # x axis lineax.spines["top"].set_color("purple")ax.spines["left"].set_color("brown") # y axis lineax.tick_params(axis="x", colors="red") # x tick labelsax.tick_params(axis="y", colors="orange") # y tick labelsplt.show()
This is what you get:
Published by Isshin Inada
Edited by 0 others
Did you find this page useful?
thumb_up
thumb_down
Comment
Citation
Ask a question or leave a feedback...
thumb_up
1
thumb_down
0
chat_bubble_outline
0
settings
Enjoy our search
Hit / to insta-search docs and recipes!