

Matplotlib
keyboard_arrow_down 83 guides
chevron_leftColors Cookbook
Adding multiple plots with different colorsChanging background color of figureChanging color based on valueChanging line color of a plotChanging the background color of a plotChanging the color of axesChanging the color of tick labelsDrawing semi-transparent plotsFilling in the area above a curveFilling in the area underneath a curveGetting specific color value from a color mapInverting color mapsMaking the background figure transparentShading an area
check_circle
Mark as learned thumb_up
0
thumb_down
0
chat_bubble_outline
0
Comment auto_stories Bi-column layout
settings
Inverting color maps in Matplotlib
schedule Aug 12, 2023
Last updated local_offer
Tags Python●Matplotlib
tocTable of Contents
expand_more Master the mathematics behind data science with 100+ top-tier guides
Start your free 7-days trial now!
Start your free 7-days trial now!
To invert a color map in Matplotlib, attach the _r suffix to the color map, like so:
x = [1,2,3]y = [4,5,6]z = [100, 200, 300]plt.scatter(x, y, c=z, cmap=plt.cm.gray_r, s=200, edgecolor='black')plt.show()
Here, the key is that we used gray_r instead of gray, which reverses the color map.
The output we get is as follows:
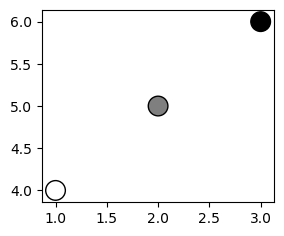
Since we used the inverted color map, the higher the value, the darker it is.
Published by Isshin Inada
Edited by 0 others
Did you find this page useful?
thumb_up
thumb_down
Comment
Citation
Ask a question or leave a feedback...
thumb_up
0
thumb_down
0
chat_bubble_outline
0
settings
Enjoy our search
Hit / to insta-search docs and recipes!