

Comprehensive Guide on Root Mean Squared Error (RMSE)
Start your free 7-days trial now!
What is root mean squared error (RMSE)?
The root mean squared error (RMSE) is a common way to quantify the error between actual and predicted values, and is defined as the square root of the average squared differences between the actual and predicted values. The mathematical formula is as follows:
Where:
$n$ is the number of predicted values
$y_i$ is the actual true value of the $i$-th data
$\hat{y}_i$ is the predicted value of the $i$-th data
As the name suggests, RMSE is simply the square root of the mean squared error (MSE). The MSE involves taking the square of the difference in the predicted and actual target, which means that the unit of MSE is not the same as that of the target value. The fact that RMSE takes the square root of MSE means that the unit of RMSE is the same as that of the response variable $y$, thereby making the interpretation easier. Loosely speaking, we can interpret RMSE as how far off the predicted values are on average.
A lower value of RMSE is favourable since this is indicative of a good model fit.
Simple example of computing root mean squared error (RMSE)
Suppose we built a simple linear model to predict three different y-values given their x-values:
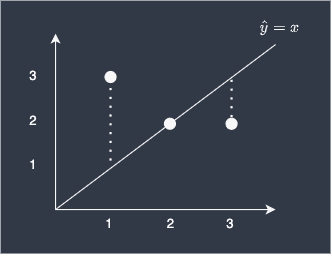
Here, our predictions are off by 2 for the first data point, 0 for the second, and 1 for the last point. To compute the RMSE of our model:
The RMSE of our model is therefore 1.29, which we can loosely interpret as meaning our predictions are off by 1.29 on average. Consider computing mean absolute error (MAE) if you wish to compute exactly the average difference between predicted and actual values.
Difference between root mean squared error (RMSE) and mean absolute error (MAE)
Mathematically, since RMSE involves squaring the differences before taking the average, the differences become more pronounced compared to MAE.
For example, consider the following dataset:
i-th data | Error | Absolute Error | Squared Error |
|---|---|---|---|
1 | 2 | 2 | 4 |
2 | -2 | 2 | 4 |
3 | 2 | 2 | 4 |
4 | 2 | 2 | 4 |
Here, the MAE would be $2$, while RMSE would be $2$.
Now consider the case when we have variance in our errors:
i-th data | Error | Absolute Error | Squared Error |
|---|---|---|---|
1 | 2 | 2 | 4 |
2 | -2 | 2 | 4 |
3 | 4 | 4 | 16 |
4 | 4 | 4 | 16 |
Here, the MAE would be $3$, while RMSE would be around $3.16$.
Now consider the case when we have an outlier:
i-th data | Error | Absolute Error | Squared Error |
|---|---|---|---|
1 | 2 | 2 | 4 |
2 | -2 | 2 | 4 |
3 | 2 | 2 | 4 |
4 | -102 | 102 | 10404 |
Here, the MAE would be $27$, while RMSE would be around $51.03$.
As we can see, RMSE penalises predictions that are far off much more compared to MAE. This means that we should use RMSE whenever we want to add more penalty when the predictions greatly differ from the actual values. For instance, suppose you have two predictions errors 5 and 10. If you wish to give more weight to the larger error terms (10 in this case), then using RMSE is desirable.
Note that we can mathematically prove that MAE will always be less than RMSE.
Upper bound of RMSE
We can prove the upper bound of RMSE in relation to MAE like so:
Where $n$ is the sample size. This means that as the number of samples increase, the upper bound of RMSE increases. This is why we should be cautious when comparing RMSE derived from two different sample sizes.
Usage of RMSE and MAE
RMSE is often used in loss functions that require optimisation through standard techniques such as gradient descent, while MAE is not. This is because MAE involves taking the absolute value, which is not easily differentiable compared to RMSE.
Interpretability of RMSE and MAE
MAE is easier to interpret than RMSE. MAE can be defined as the average absolute differences between the actual and predicted values. In contrast, RMSE can only be loosely defined as so, with the added interpretation that higher error terms are penalised more.
Computing root mean squared error (RMSE) using scikit-learn
RMSE is equal to the square root of MSE. To compute RMSE using scikit-learn, use the mean_squared_error function, and then set the argument squared=False:
                    from sklearn.metrics import mean_squared_error
y_true = [2,6,5]y_pred = [7,4,3]mean_squared_error(y_true, y_pred, squared=False)


            3.3166247903554