

Matplotlib
keyboard_arrow_down 83 guides
chevron_leftText, Label and Annotations Cookbook
Adding a title to a plotAdding arrows to an annotationAdding axis labels to a plotAdding markers to a plotAnnotating data pointsApplying an offset to annotationsChanging the default font sizeChanging the marker size in scatterplotsChanging the number of ticksChanging the tick sizeRemoving certain ticksRemoving column name label from pie chartsRemoving default axis labelsRotating axis labelsRotating custom tick labelsSpecifying custom tick labelsWriting mathematical expressions
check_circle
Mark as learned thumb_up
0
thumb_down
0
chat_bubble_outline
0
Comment auto_stories Bi-column layout
settings
Changing the marker size of scatter plots in Matplotlib
schedule Aug 11, 2023
Last updated local_offer
Tags Python●Matplotlib
tocTable of Contents
expand_more Master the mathematics behind data science with 100+ top-tier guides
Start your free 7-days trial now!
Start your free 7-days trial now!
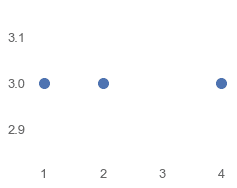
Constant size
To change the size of all markers in Matplotlib, specify the s argument in plt.scatter(~):
x = [1,2,4]y = [3,3,3]plt.scatter(x, y, s=100)plt.show()
This produces the following output:
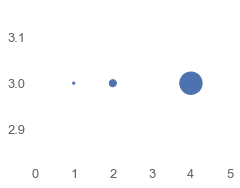
Variable size
To vary the size of individual markers, pass in an array instead:
x = [1,2,4]y = [3,3,3]sizes = [5,50,500]plt.scatter(x, y, s=sizes)plt.xlim(0,5)plt.show()
The output is as follows:
Published by Isshin Inada
Edited by 0 others
Did you find this page useful?
thumb_up
thumb_down
Comment
Citation
Ask a question or leave a feedback...
thumb_up
0
thumb_down
0
chat_bubble_outline
0
settings
Enjoy our search
Hit / to insta-search docs and recipes!