

Comprehensive Guide on Sample Mean
Start your free 7-days trial now!
To estimate the population mean, we can collect some observations from the population to form a sample. We would expect the average of these observations, which is called the sample mean, to be a good estimate of the true population mean.
Sample mean
The mean of a sample of observations $(x_1,x_2,...,x_n)$ is computed by:
$\bar{x}$ is known as the sample mean.
Computing the sample mean
Compute the sample mean of the following sample:
Solution. The size of the sample is $n=4$. Using the formula for the sample mean:
Therefore, the mean of our sample is $4$.
Samples with different distribution can have the sample mean
The sample mean is a measure of the central tendency of a sequence of values. However, the sample mean itself is not sufficient to describe the distribution of the values since vastly different distributions can have the same sample mean. For instance, consider the following frequency distribution of two samples:
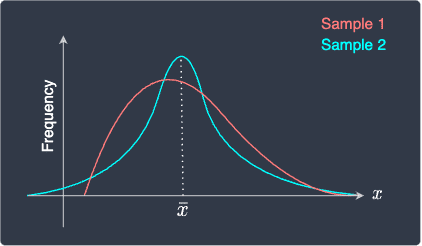
Here, their distributions look different but they have the same sample mean. Therefore, when numerically describing a sample, we should additionally quote other statistical measures such as the sample variance.
Properties of the sample mean
Expected value of the sample mean
The expected value of the sample mean $\bar{X}$ is equal to the population mean $\mu$, that is:
Equivalently, we say that the expected value is an unbiased estimator of the population mean.
Proof. From the definition of sample mean, we have that:
Taking the expected value of both sides and using the properties of expected values to simplify:
Since the expected value of $X_i$ is the population mean $\mu$, we have that:
This completes the proof.
Variance of the sample mean
The variance of the sample mean is:
Where:
$\sigma^2$ is the population variance.
$n$ is the sample size.
Proof. The variance of the sample mean is:
Because $X_1,X_2,\cdots,X_n$ are independent, we know from theoremlink that we can swap the position of the summation and variance to get:
This completes the proof.
Standard error of the sample mean
The standard error of the sample mean, which is defined as the standard deviation of the sample mean, is given by:
Where:
$\sigma$ is the population standard deviation.
$n$ is the sample size.
Proof. We already know that the variance of the sample mean is:
To obtain the standard error, we take the square root of the variance:
This completes the proof.
Computing the sample mean in Python
Computing the sample mean is easy using Python's numpy library. Import the library, and use the mean(~) method:
                    import numpy as npnp.mean([2,4,8,2])


            4.0