

Sample estimators
Start your free 7-days trial now!
What is a sample estimator?
To estimate a population parameter, we typically extract a small sample from the population and compute the estimate based on the sample. For instance, to compute the average salary of a fresh graduate, we would go out and find 100 random fresh graduates and ask for their salaries. We would then take the average of the 100 salaries to estimate the mean salary of all fresh graduates.
Because we are picking random fresh graduates, the salaries will also be random. Therefore, we can represent the salary as a random variable $X$. Our sample $\boldsymbol{X}$ consists of $n=100$ random salaries:
Intuition should tell you that the mean of this sample would be a good estimate of the mean salary of all fresh graduates:
Here, $\bar{X}$ is known as the sample mean. More generally, the sample mean is a type of sample estimator because we are using sampled data to estimate a population parameter. Mathematically, a sample estimator is defined as a function of observations $X_1,X_2,\cdots,X_n$ of a random sample that estimates a population parameter.
Defining multiple estimators for a population parameter
The sample mean is the most common estimator for the population mean, but we could use any other estimator for the population mean. For instance, consider the estimator $Y$ below:
We could also use $Y$ to estimate the population mean, although we will later prove that the sample mean $\bar{X}$ is a better estimator than $Y$. The point here is that estimators can be of any form - there is potentially an infinite number of estimators we can define for a population parameter. Of course, some estimators possess properties that make them more desirable than others.
Estimators are random variables
Because a sample estimator is a function of the random variables $X_i$, the sample estimator itself is a random variable. Here's a diagram that illustrates this point for the sample mean:
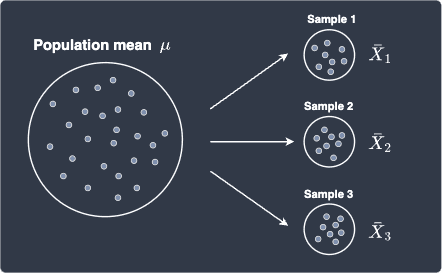
Every time we draw a sample from the population, we will end up with different values for the sample mean because the fresh graduates we ask are randomly chosen. For instance, for the first sample, the sample mean could be $\$1200$, and for the second sample, the sample mean could be $\$1100$.
Because estimators are random variables, it makes sense to talk about properties related to random variables such as their expected value, variance and probability distribution. In the upcoming sections, we will derive these properties for common sample estimators such as the sample mean.
Sampling distribution of an estimator
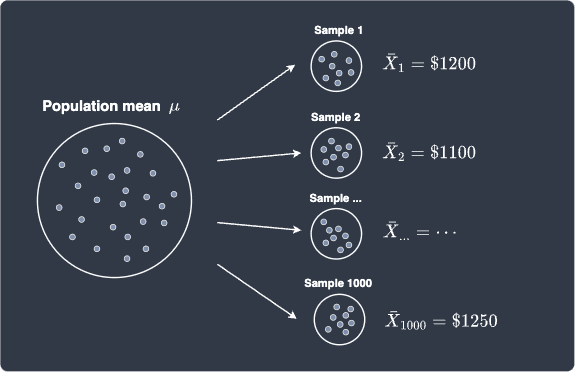
Suppose we ask 100 random fresh graduates for their salaries to form a single sample. Let's say the mean of this sample is $\$1200$. Next, we ask another 100 random fresh graduates to obtain a second sample. This time, let's say the sample mean is $\$1100$. Suppose we repeat this sampling process 1000 times, which means we would end up with 1000 samples (each of size 100) and of course, 1000 sample means. Let's illustrate the sampling process:
Let's plot the frequency histogram of our 1000 sample means:

This distribution is known as the sampling distribution of the sample mean. The sampling distribution of an estimator is the theoretical distribution of an estimate computed by the estimator for an infinite number of samples. The histogram above is specifically the sampling distribution for the sample mean - other estimators may have a different sampling distribution.
As we shall explore later, the central limit theorem guarantees that regardless of what the true distribution is for our original random variable $X$, the sampling distribution of the sample mean will approximately follow a normal distribution. Therefore, it's no coincidence that we ended up with a normal-looking distribution above!
Common sample estimators
In most cases, we are interested in estimating population parameters such as the population mean, variance, covariance and correlation. We will cover the sample estimators for each of these parameters:
sample mean to estimate population mean.
sample variance to estimate population variance.
sample covariance to estimate population covariance.
sample correlation to estimate population correlation.
We will also discuss basic statistical properties of sample estimators such as bias and mean square error.