Guide on Logging Asset Metadata in Dagster
Start your free 7-days trial now!
We can easily log metadata when creating our assets in Dagster. We will then be able to see them in the Dagster UI.
Logging asset metadata
To demonstrate, let's set up the same Dagster environment as we did in our Getting Started with Dagster guide. Our project structure is like so:
my_dagster_code_location├── __init__.py└── my_assets.py
Where the __init__.py is:
                    from dagster import Definitions, load_assets_from_modulesfrom . import my_assets
all_assets = load_assets_from_modules([my_assets])defs = Definitions(assets=all_assets)
Copy the paste the following code into my_assets.py:
from dagster import asset, MetadataValue, Outputimport pandas as pd
@asset(name="iris_data")def get_iris_data(): return df
@asset(name="setosa")def get_setosa(iris_data): return Output( value=df_setosa, metadata={ "n_rows": len(df_setosa), } )
Here, note the following:
instead of returning
df_setosadirectly, we wrap the return value in Dagster'sOutputobject. This allows us to log metadata (n_rowsandpreviewin our case).Dagster supports logs in markdown format via
MetadataValue.md(-). We use a Pandas DataFrame'sto_markdown()method to convert the DataFrame into a markdown string.
Let's now launch our Dagster UI like so:
                    dagster dev -m my_dagster_code_location


            2023-07-15 13:22:52 +0800 - dagit - INFO - Serving dagit on http://127.0.0.1:3000 in process 49252
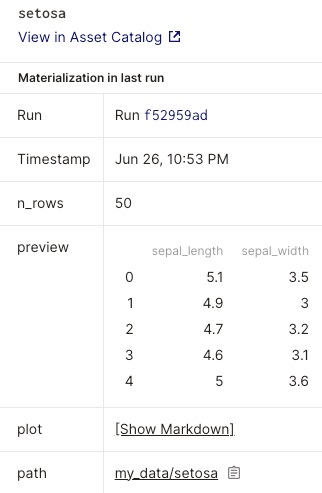
In the Dagster UI, materialize the setosa asset. Click on setosa and we will see the meta information that we logged earlier:
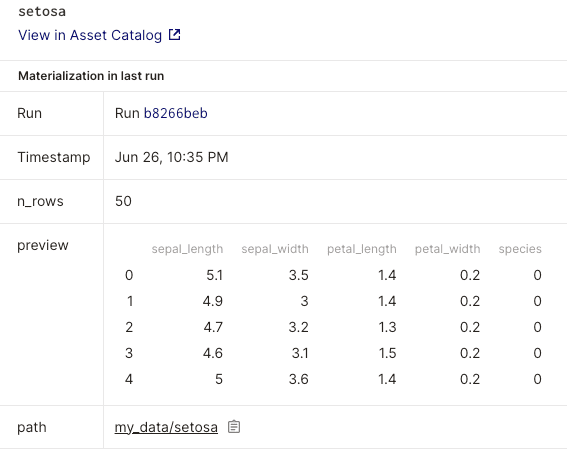
Great, we see our markdown parsed elegantly as a table!
The other way of logging asset metadata is by using the context.add_output_metadata(-) function in a custom IO manager. This approach is explored in this sectionlink. The advantage of using an IO manager is that we do not need to wrap the output of our function in Dagster's Output(-). This is great because tampering with the output of a function makes unit tests a challenge to write.
Visualizing changes in metadata over time
Using the Dagster UI, we can visualize the changes in the value of metadata over time. Suppose we materialized the setosa asset multiple times, each time adding a random integer to the n_rows metadata value.
We can view the metadata plots by clicking on the asset in the graph like so:
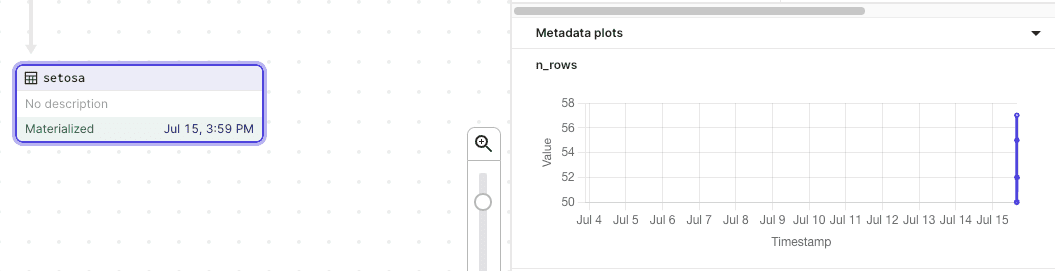
As of now, Dagster does not support changing the scale of the Timestamp axis, which is set to days by default. Technically, there are several points plotted in the above time series graph, but because the interval between each run is too short, we see more or less a vertical line.
We can also access a bigger plot by navigating to the Assets tab in the header and clicking on our setosa asset. Next, we click on the Plots tab to see the same time-series graph:
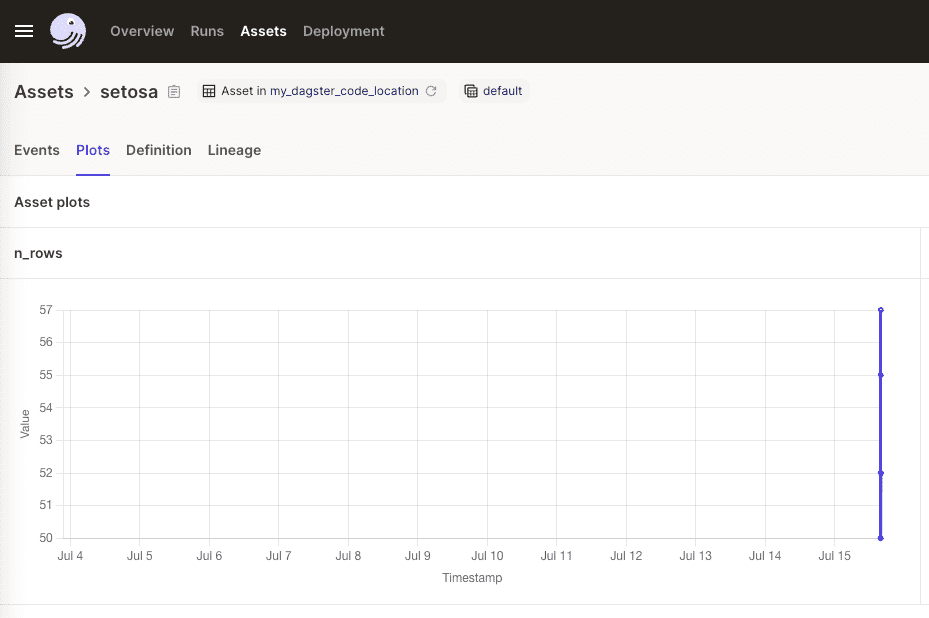
Again, we cannot change the x-axis scale here for now 😟.
Logging images
Since Dagster allows logging in markdown format, we can also log images! Copy and paste the following code into my_assets.py:
from dagster import asset, MetadataValue, Outputimport matplotlib.pyplot as pltimport pandas as pd
# for handling imageimport base64from io import BytesIO
@asset(name="iris_data")def get_iris_data(): return df
def get_img_as_md(df_setosa): plt.figure(figsize=(10, 6)) plt.title("Setosa sepal length vs petal length") plt.scatter(df_setosa["sepal_length"], df_setosa["petal_length"]) buffer = BytesIO() plt.savefig(buffer, format="png") image_data = base64.b64encode(buffer.getvalue()) return f"})"
@asset(name="setosa")def get_setosa(iris_data): return Output( value=df_setosa, metadata={ "n_rows": len(df_setosa), "plot": MetadataValue.md(get_img_as_md(df_setosa)) }, )
Here, the get_img_as_md(-) method returns an image encoded as base64 in markdown format. More specifically, the image is first generated using matplolib and then stored as a buffer using BytesIO(). We then encode the buffer as base64 and return this as a markdown string.
Back in our Dagster UI, materialize the assets once more. Click on the setosa asset to see:
Click on Show Markdown in the plot field to see our image:
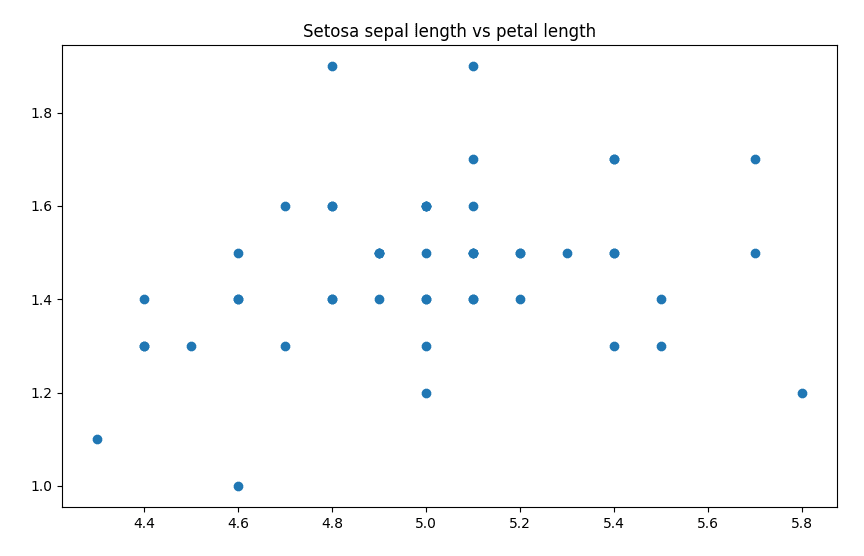
Great, we managed to log a scatter plot image as metadata!
Adding description and metadata to assets
Besides the name property, we can supply other properties such as description and metadata like so:
from dagster import Definitions, assetimport pandas as pd
@asset(name="iris_data", description="My description", metadata={"key1": "val1", "key2": "val2"})def get_iris_data():
The description of the assets will be displayed in multiple places. Firstly, it will be displayed in the data lineage:
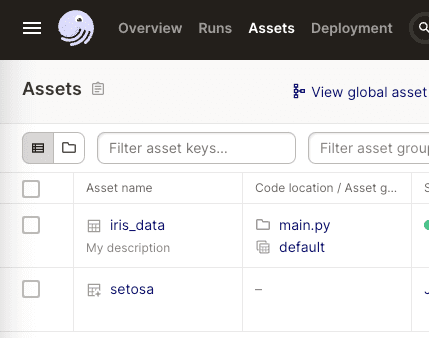
It will also be displayed in the assets catalog, which can be found by clicking on the Assets header:
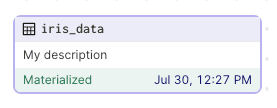
The description as well as the asset metadata will be displayed in the data lineage screen when clicking on the asset:
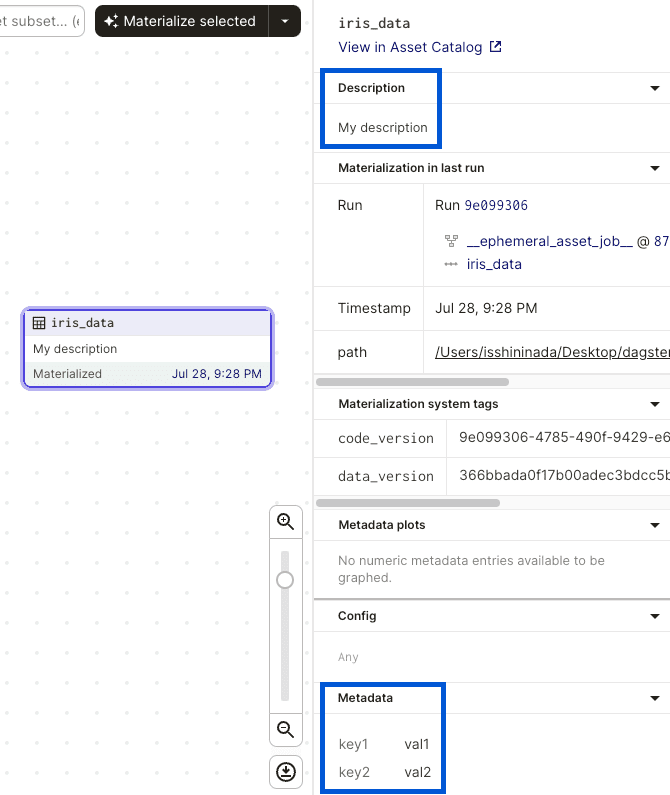
Note that the metadata property here is not intended to describe the content of the asset (e.g. the number of rows of the outputted DataFrame), but rather the nature of the asset (e.g. the name of the person who wrote the code).
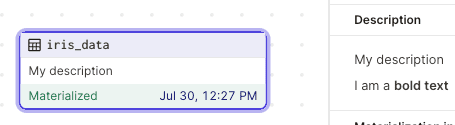
The description property is parsed as markdown. For instance, consider the following:
@asset(name="iris_data", description="My **description**")def get_iris_data():
This will be rendered in the UI like so:
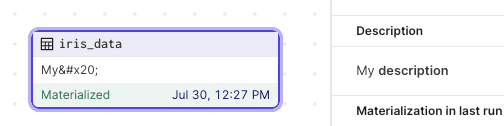
Notice how the description in the graph is parsed incorrectly although the description in the right panel is parsed correctly. One quick fix is to write in plain text for the first line, then switch to markdown in the subsequent lines:
@asset(name="iris_data", description="My description\n\nI am a **bold text**")def get_iris_data():
This will render the following: