

Pandas
keyboard_arrow_down 655 guides
chevron_leftMiscellaneous Cookbook
Adjusting number of rows that are printedAppending DataFrame to an existing CSV fileChecking differences between two indexesChecking if a DataFrame is emptyChecking if a variable is a DataFrameChecking if index is sortedChecking if value exists in IndexChecking memory usage of DataFrameChecking whether a Pandas object is a view or a copyConcatenating a list of DataFramesConverting a DataFrame to a listConverting a DataFrame to a SeriesConverting DataFrame to a list of dictionariesConverting DataFrame to list of tuplesCounting the number of negative valuesCreating a DataFrame using cartesian product of two DataFramesDisplaying DataFrames side by sideDisplaying full non-truncated DataFrame valuesDrawing frequency histogram of DataFrame columnExporting Pandas DataFrame to PostgreSQL tableHighlighting a particular cell of a DataFrameHighlighting DataFrame cell based on valueHow to solve "ValueError: If using all scalar values, you must pass an index"Importing BigQuery table as Pandas DataFramePlotting two columns of DataFramePrinting DataFrame on a single linePrinting DataFrame without indexPrinting DataFrames in tabular formatRandomly splitting DataFrame into multiple DataFrames of equal sizeReducing DataFrame memory sizeSaving a DataFrame as a CSV fileSaving DataFrame as Excel fileSaving DataFrame as feather fileSetting all values to zeroShowing all dtypes without truncationSplitting DataFrame into multiple DataFrames based on valueSplitting DataFrame into smaller equal-sized DataFramesWriting DataFrame to SQLite
check_circle
Mark as learned thumb_up
2
thumb_down
0
chat_bubble_outline
0
Comment auto_stories Bi-column layout
settings
Drawing frequency histogram of Pandas DataFrame column
schedule Aug 12, 2023
Last updated local_offer
Tags Python●Pandas
tocTable of Contents
expand_more Master the mathematics behind data science with 100+ top-tier guides
Start your free 7-days trial now!
Start your free 7-days trial now!
Consider the following DataFrame:
import pandas as pd
'class':['A','A','B','A','B','C'], 'name':['alex','bob','cathy','doge','eric','fred']})df
class name0 A alex1 A bob2 B icathy3 A doge4 B eric5 C fred
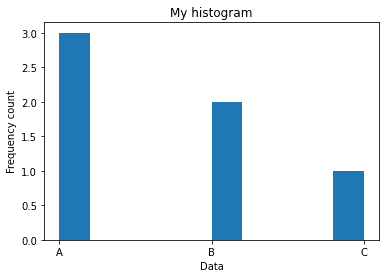
Using matplotlib
To draw a frequency histogram of the class column:
                    import matplotlib.pyplot as plt
plt.hist(df['class'])plt.ylabel('Frequency count')plt.xlabel('Data');plt.title('My histogram')plt.show()
This gives you the following plot:
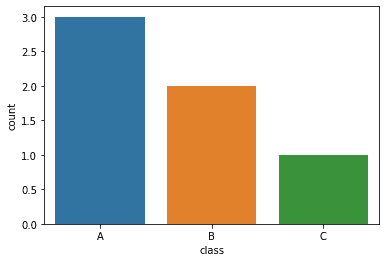
Using seaborn
The other alternative is to use the seaborn library:
import seaborn as snssns.countplot(x=df['class'])
We get the following:
Published by Isshin Inada
Edited by 0 others
Did you find this page useful?
thumb_up
thumb_down
Comment
Citation
Ask a question or leave a feedback...
thumb_up
2
thumb_down
0
chat_bubble_outline
0
settings
Enjoy our search
Hit / to insta-search docs and recipes!