

Matplotlib
keyboard_arrow_down 83 guides
chevron_leftLegend Cookbook
check_circle
Mark as learned thumb_up
1
thumb_down
0
chat_bubble_outline
0
Comment auto_stories Bi-column layout
settings
Specifying exact location of the legend in Matplotlib
schedule Aug 12, 2023
Last updated local_offer
Tags Python●Matplotlib
tocTable of Contents
expand_more Master the mathematics behind data science with 100+ top-tier guides
Start your free 7-days trial now!
Start your free 7-days trial now!
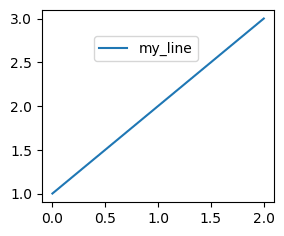
To specify the exact location of the legend in Matplotlib, set the bbox_to_anchor and loc parameters of the legend(~) method:
plt.plot([1,2,3], label="my_line")plt.legend(loc="upper right", bbox_to_anchor=(0.7,0.9))plt.show()
Make sure to specify both the loc as well as the bbox_to_anchor parameters. You can think of the loc as the origin, and the bbox_to_anchor as the offset from this origin. The loc="upper right" means that top right corner will take on the coordinates of (0,0), and the bbox_to_anchor then shifts by 0.3 units (i.e. 30% shift) to the left, and 0.1 units (i.e. 10% shift) to the bottom.
The result is as follows:
Published by Isshin Inada
Edited by 0 others
Did you find this page useful?
thumb_up
thumb_down
Comment
Citation
Ask a question or leave a feedback...
thumb_up
1
thumb_down
0
chat_bubble_outline
0
settings
Enjoy our search
Hit / to insta-search docs and recipes!