

Matplotlib
keyboard_arrow_down 83 guides
chevron_leftLegend Cookbook
check_circle
Mark as learned thumb_up
1
thumb_down
0
chat_bubble_outline
0
Comment auto_stories Bi-column layout
settings
Placing the legend outside the plot in Matplotlib
schedule Aug 12, 2023
Last updated local_offer
Tags Python●Matplotlib
tocTable of Contents
expand_more Master the mathematics behind data science with 100+ top-tier guides
Start your free 7-days trial now!
Start your free 7-days trial now!
To place the legend outside the plot in Matplotlib, use the bbox_to_anchor argument of the legend method:
plt.plot([1,2], label="my_line")plt.legend(bbox_to_anchor=(1.05, 1))plt.show()
This would output the following:
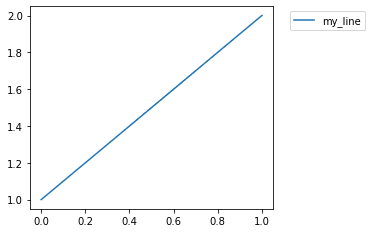
The bbox_to_anchor argument is used to specify the precise placement of the legend. It takes two parameters: the x position and the y position. The actual graph itself is 1 unit by 1 unit, and the origin (0,0) is set to the bottom-left corner while the right-top corner is given the position of (1,1). Therefore, a bbox_to_anchor of (1.05, 1) places our legend outside the graph by 0.05 units to the right of the graph.
Published by Isshin Inada
Edited by 0 others
Did you find this page useful?
thumb_up
thumb_down
Comment
Citation
Ask a question or leave a feedback...
thumb_up
1
thumb_down
0
chat_bubble_outline
0
settings
Enjoy our search
Hit / to insta-search docs and recipes!