

Matplotlib
keyboard_arrow_down 83 guides
chevron_leftSubplots Cookbook
check_circle
Mark as learned thumb_up
0
thumb_down
0
chat_bubble_outline
1
Comment auto_stories Bi-column layout
settings
Making plots side by side in Matplotlib
schedule Aug 10, 2023
Last updated local_offer
Tags Python●Matplotlib
tocTable of Contents
expand_more Master the mathematics behind data science with 100+ top-tier guides
Start your free 7-days trial now!
Start your free 7-days trial now!
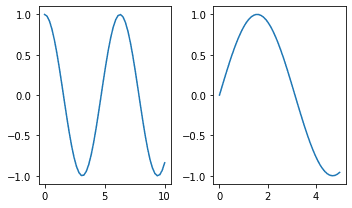
Basic way to graph two plots side by side
To draw plots side by side in matplotlib:
This gives us the following:
Generating a 3x2 grid of subplots
To generate a 3x2 grid of subplots:
                    # Set the figure size fig = plt.figure(figsize=(9,5))
for i in range(6):  # In a 3x2 grid, add a graph in the (i+1)-th position  fig.add_subplot(3,2,i+1)  plt.xlabel('x')  plt.ylabel('y')  plt.title(f"Graph {i+1}")  plt.scatter([1,2],[3,4])
fig.tight_layout()
This generates the following:

Published by Isshin Inada
Edited by 0 others
Did you find this page useful?
thumb_up
thumb_down
Comment
Citation
Ask a question or leave a feedback...
thumb_up
0
thumb_down
0
chat_bubble_outline
1
settings
Enjoy our search
Hit / to insta-search docs and recipes!