

Matplotlib
keyboard_arrow_down 83 guides
chevron_leftSubplots Cookbook
check_circle
Mark as learned thumb_up
0
thumb_down
0
chat_bubble_outline
1
Comment auto_stories Bi-column layout
settings
Creating subplots in Matplotlib
schedule Aug 12, 2023
Last updated local_offer
Tags Python●Matplotlib
tocTable of Contents
expand_more Master the mathematics behind data science with 100+ top-tier guides
Start your free 7-days trial now!
Start your free 7-days trial now!
We can create subplots in Matplotlib by calling plt.subplots(~).
Example
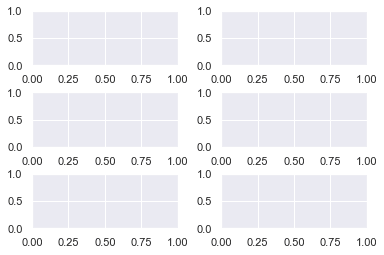
To create a figure object with 3 rows of subplots and 2 columns:
                    import matplotlib.pyplot as plt
fig, ax = plt.subplots(3, 2)fig.subplots_adjust(hspace=0.5, wspace=0.3)     # Adjust the spacing between subplotsplt.show()
This produces the following output:
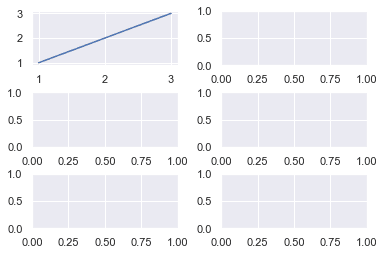
The resulting figure is composed of an array of axes objects. To add data we need to index into one of the axes objects:
                    fig, ax = plt.subplots(3, 2)fig.subplots_adjust(hspace=0.5, wspace=0.3)     # Adjust the spacing between subplots
# Add data to the top-left subplotax[0, 0].plot([1,2,3], [1,2,3])plt.show()
We can see that data is plotted onto the top-left subplot:
Published by Arthur Yanagisawa
Edited by 0 others
Did you find this page useful?
thumb_up
thumb_down
Comment
Citation
Ask a question or leave a feedback...
thumb_up
0
thumb_down
0
chat_bubble_outline
1
settings
Enjoy our search
Hit / to insta-search docs and recipes!