

Finding local minima, maxima and inflection points using differentiation
Start your free 7-days trial now!
Stationary point
Let $f(x)$ be a function. The stationary points of a function are points where its slope is equal to zero, that is, when $f'(x)=0$. In other words, stationary points are places in the function that are flat.
There are 3 types of stationary points:
local maximum - the curve takes on a 'n' shape at the point (concave down).
local minimum - the curve takes on a 'u' shape at the point (concave up).
inflection (saddle) point - the curve changes concavity at the point (either from concave down to concave up or the reverse).
The 3 types of stationary points are illustrated below:
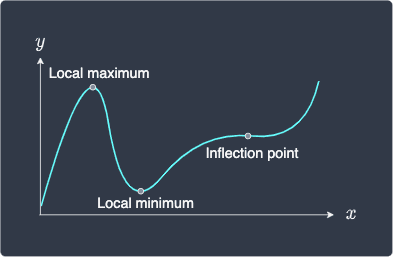
The reason why we describe maximum and minimum points as local is to distinguish them from global maximum and minimum points. For instance, we see that the above function has a global minimum when $x=0$. In some cases, local maximums and minimums are also global maximums and minimums For instance, a parabola $y=x^2$ shares the same local minimum and global minimum.
Identifying the type of stationary point
Once we compute the solutions to $f'(x)=0$, we will know the positions of the stationary points, but how do we identify their type? There are two main ways to do so:
draw a sign diagram and check the sign of the left and right region.
perform the so-called second derivative test.
Drawing a sign diagram
The first approach is to draw the sign diagram to see whether the curve is on an upward or downward trend at the left and right of the point.
Below are the sign diagrams for the different types of stationary points:
Stationary point ($f'(a)=0$) | Sign diagram | Shape of curve near $x=a$ |
|---|---|---|
Local maximum | 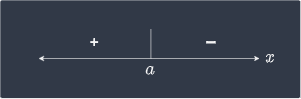
| 
|
Local minimum | 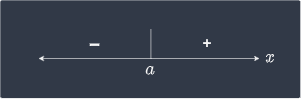
| 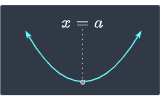
|
Stationary inflection (type one) | 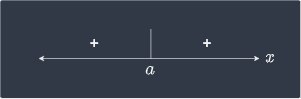
| 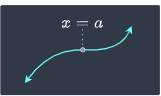
|
Stationary inflection (type two) | 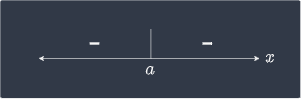
| 
|
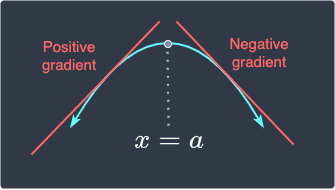
Let's go over how we can interpret the sign diagram. The sign diagram for the local maximum is:
Here:
the plus sign on the left means that the derivative of the region to the left of $a$ is positive.
the negative sign on the right means that the derivative of the region to the right of $a$ is negative.
The below diagram should make this clear:
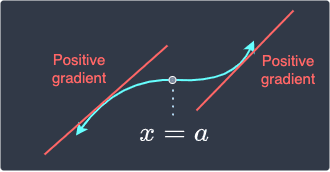
For the first type of stationary inflection point, the sign diagram is:
In this case, the sign of the derivative is both positive in the left and right region:
Finding the position and type of all stationary points of a function
Consider the following function:
Determine the positions as well as the types of all stationary points.
Solution. To find the position of the stationary points, take the derivative of $f$ with respect to $x$ like so:
Equating this to zero gives us the $x$ coordinates of the stationary points:
The $y$ coordinate of the first stationary point is:
The $y$ coordinate of the second stationary point is:
Therefore, the two stationary points are $(-3,1)$ and $(-1,-3)$. Let's now identify the type of these stationary points using the sign diagram:
$x$ | $x<-3$ | $x=-3$ | $-3<x<-1$ | $x=-1$ | $x>-1$ |
$f'(x)$ | positive | 0 | negative | 0 | positive |
This means that the stationary point $(-3,1)$ is a local maximum and $(-1,-3)$ is a local maximum!
Let's visually check that this is true by plotting $f(x)$:
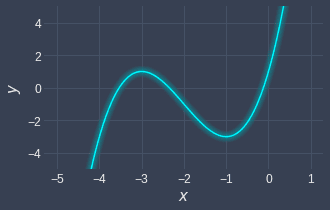
We see that we have two stationary points:
a local maximum at $(-3,1)$.
a local minimum at $(-1,-3)$.
Great, this agrees with our numeric conclusion!
Second derivative test
Once we know the positions of the stationary points, we can also use the so-called second derivative test to identify their type. This test involves checking the sign of the second derivative $f''(a)$ evaluated at some stationary point $a$.
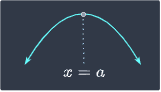
Let's take a step back and review how we can interpret the second derivative. Recall that the first derivative gives us the slope of the function, and the second derivative gives us the rate of change of the slope. Let's plot the tangent lines near a local maximum:
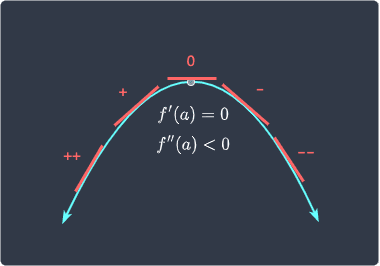
Here, can you see how the slope of the tangent lines are always decreasing as we go from left to right? This means that the rate of change of the slope is negative, that is, $f''(x)\lt0$.
The other interpretation of the second derivative is concavity (or convexity); a negative second derivative represents a concave down (n) shape. As illustrated in the above diagram, local maximums occur when the shape of the curve is concave down, that is, $f''(x)\lt0$.
The case for local minimums is the exact opposite:
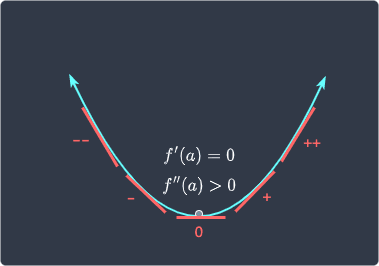
The slope of the tangent line as we go from left to right increases, and so the rate of change of slope is positive, that is, $f''(x)\gt0$. Equivalently, local minimums occur when the shape of the curve is concave up (u-shape), which again means $f''(x)\gt0$.
Now, this leaves the case of inflection points. Here's an example of an inflection point:
What do you think the second derivative $f''(a)$ would be? To answer this, let's see how the slope of the tangent lines changes around this region:
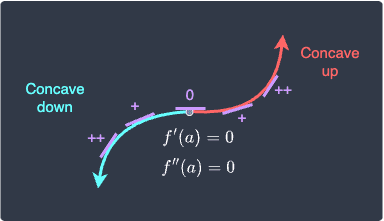
Observe the following:
in the left region of $x=a$, we see that the slope of the tangent line is decreasing. This means that $f''(x)$ is negative (concave down).
in the right region of $x=a$, we see that the slope of the tangent line is increasing. This means that $f''(x)$ is positive (concave up).
in the neighborhood of $x=a$, we see that the slope of the tangent line does not change. Since the rate of change of the slope of the tangent line is zero, we have that $f''(x)=0$. Also, at this point $x=a$, we see a change in concavity - the left side is concave down while the right side is concave up.
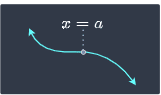
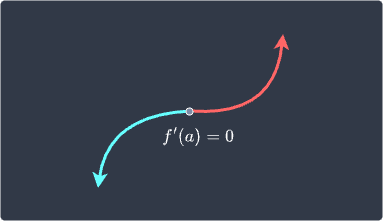
Inflection points, which are defined as points where the concavity changes, do not necessarily have to be a stationary points with the first derivative equaling zero. For instance, consider the following scenario:
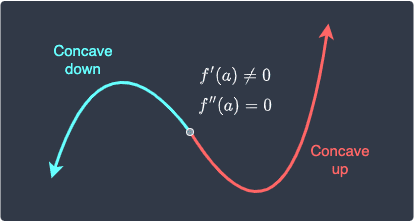
Here, the point in the center is clearly not stationary because the first derivative is not equal to zero, that is, the curve is not flat at this point. However, because the concavity changes from concave downwards to concave upwards as we increase the value of $x$, the second derivative at this point is zero, that is, $f''(a)=0$.
To summarize, the second derivative test involves checking the sign of the second derivative evaluated at some stationary point $a$ like so:
Second derivative | Type of stationary point |
|---|---|
$f''(a)\lt0$ | Local maximum |
$f''(a)=0$ | Inflection point |
$f''(a)\gt0$ | Local minimum |
Identifying stationary points of a function
Consider the same function as before:
Use the second derivative test to identify the stationary points.
Solution. We already found the stationary points to be $(-3,1)$ and $(-1,3)$. Instead of using the sign diagram, we will now use the second derivative test to identify the nature of these stationary points.
The first derivative of $f$ with respect to $x$ is:
The second derivative of $f$ with respect to $x$ is:
Let's substitute the $x$-coordinate of the first stationary point $(-3,1)$ to get:
Since $f''(-1)\lt0$, this point must be a local maximum.
Next, let's substitute the $x$-coordinate of the second stationary point $(-1,-3)$ to get:
This time, since $f''(-1)\gt0$, this point must be a local minimum. The results obtained here indeed aligns with the those obtained using the sign diagram!