

near_me
Linear Algebra
keyboard_arrow_down 54 guides
chevron_leftActivation functions
check_circle
Mark as learned thumb_up
0
thumb_down
0
chat_bubble_outline
0
Comment auto_stories Bi-column layout
settings
Comprehensive Guide on tanh
schedule May 20, 2023
Last updated local_offer
Tags tocTable of Contents
expand_more Master the mathematics behind data science with 100+ top-tier guides
Start your free 7-days trial now!
Start your free 7-days trial now!
The $\mathrm{tanh}$ curve looks similar to the sigmoid curve in that the shape is s-like. $\mathrm{tanh}$ takes in any real value as input, and outputs a value from $-1$ to $1$.
The following is a graph of $\mathrm{tanh}$ and sigmoid function:
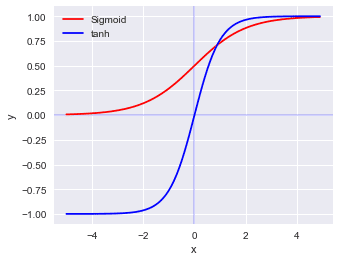
Mathematically, we can represent $\mathrm{tanh}(x)$ like so:
$$\mathrm{tanh}(x)=\frac{e^x-e^{-x}}{e^x+e^{-x}}$$
Derivative
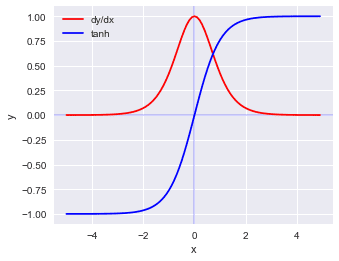
What makes $\mathrm{tanh}$ appealing as an activation function is that the derivative of $\mathrm{tanh}$ is clean:
$$\frac{d}{dx}\mathrm{tanh}(x)=1-\mathrm{tanh}(x)^2$$
The graph of the derivative of $\mathrm{tanh}(x)$ looks like the following:
Code
The code used to generate the plot is as follows:
                    import numpy as npimport matplotlib.pyplot as pltplt.style.use('seaborn-whitegrid')plt.style.use('seaborn')
def sigmoid(x):    return 1 / (1 + np.exp(-x))
x_tanh = np.arange(-5, 5, 0.1)y_tanh = np.tanh(x)plt.figure(figsize=(5,4))plt.xlabel("x")plt.ylabel("y")plt.axhline(0, color="blue", alpha=0.2)plt.axvline(0, color="blue", alpha=0.2)x_sigmoid = np.arange(-5, 5, 0.1)y_sigmoid = sigmoid(x)plt.plot(x_sigmoid, y_sigmoid, color="red", label="Sigmoid")plt.plot(x_tanh, y_tanh, color="blue", label="tanh")plt.legend()
Published by Isshin Inada
Edited by 0 others
Did you find this page useful?
thumb_up
thumb_down
Comment
Citation
Ask a question or leave a feedback...
thumb_up
0
thumb_down
0
chat_bubble_outline
0
settings
Enjoy our search
Hit / to insta-search docs and recipes!